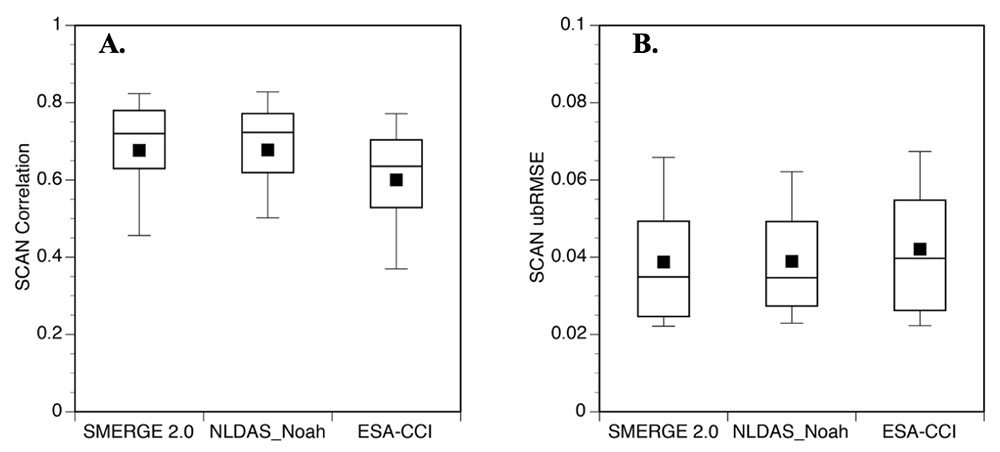

Comparison of SMERGE 2.0, NLDAS-Noah, and ESA-CCI with in situ data for the SCAN network for following evaluation metrics: (A) Correlation (R); (B) ubRMSE.
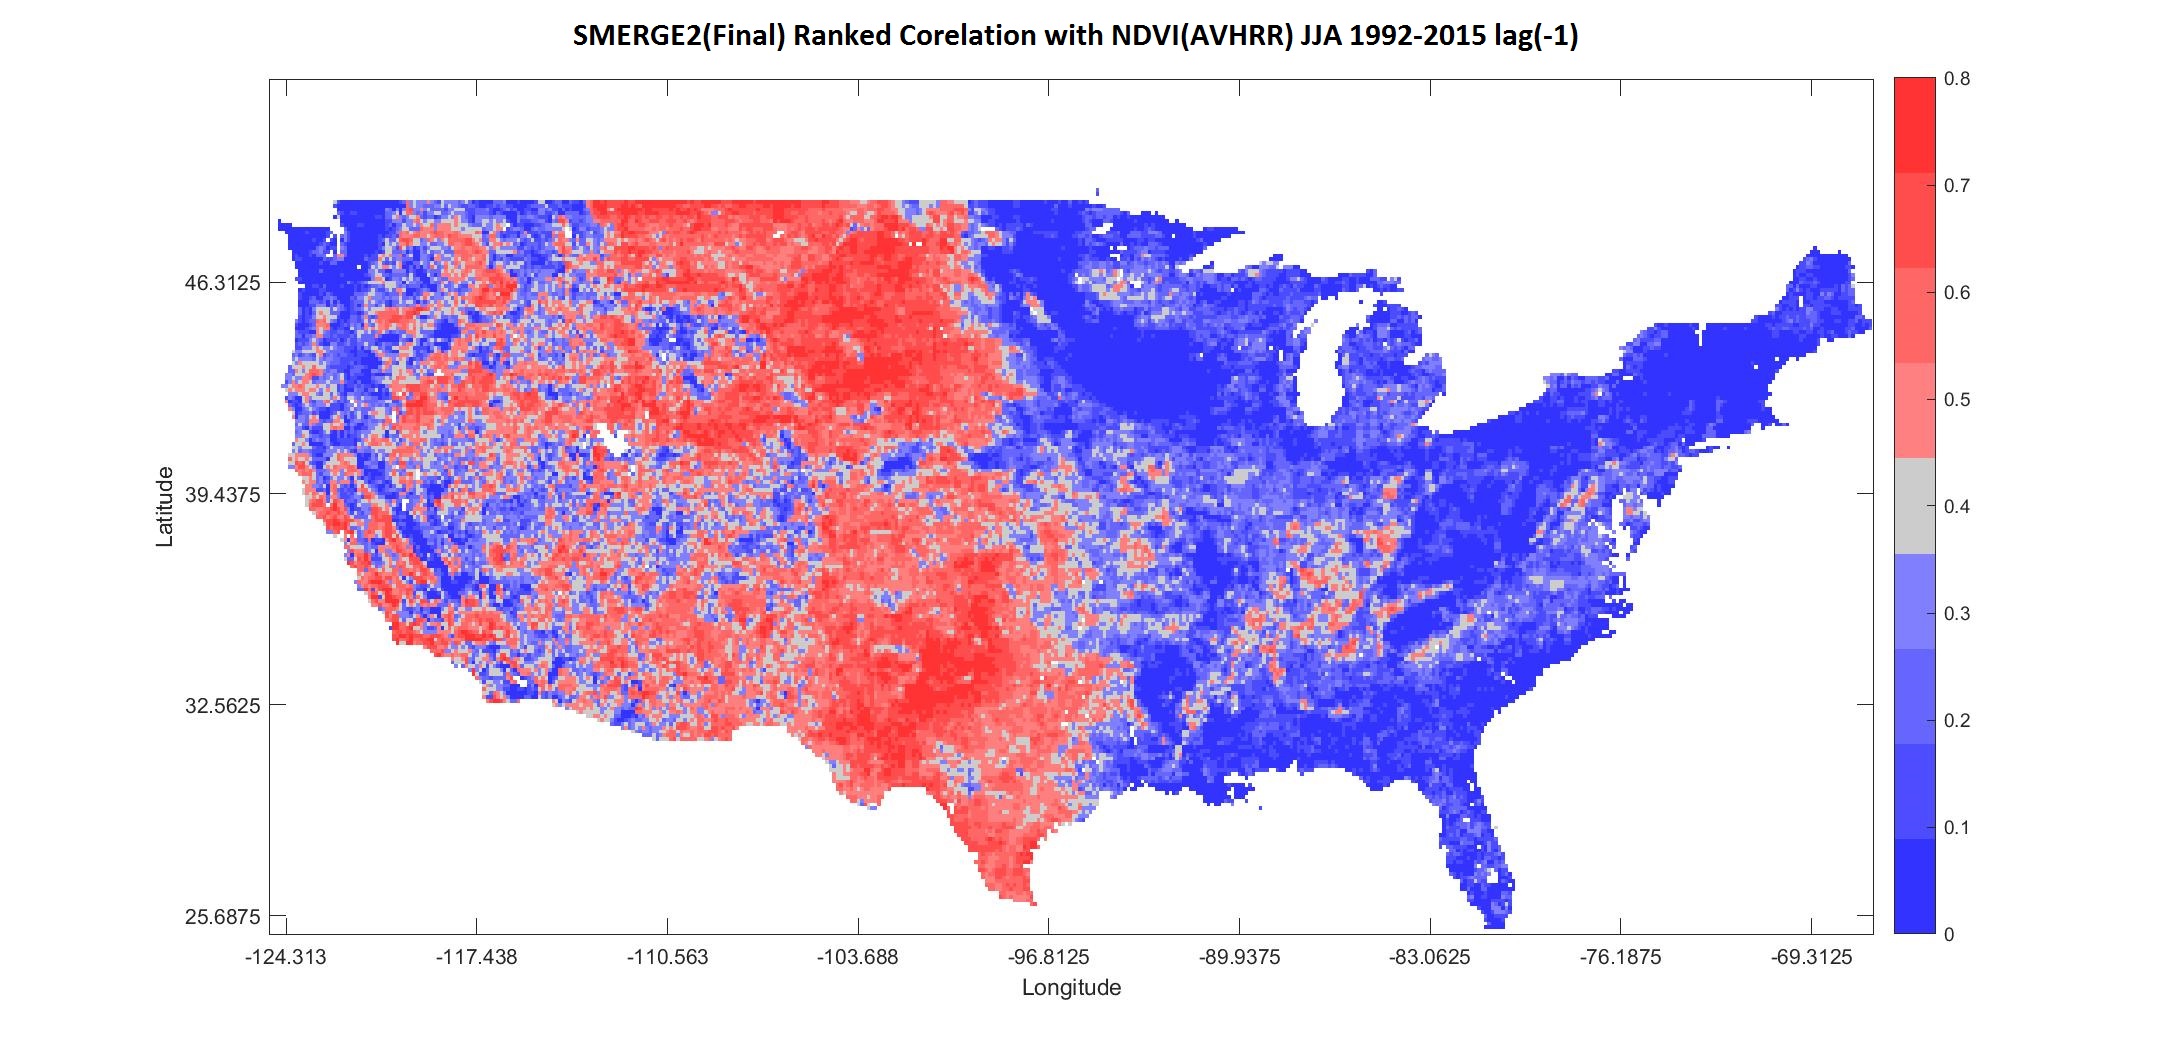
Ranked Correlation Comparison with NVDI (1992 to 2015) Based on Land Cover (A – Herbaceous, Planted /Cultivated, Developed; B – Barren, Shrubland; C – Forest, Wetland). SMAP L4 is based on (2015 to 2018).
| Land Cover Type | SMERGE 2.0 | NLDAS-Noah | ESA-CCI | SMAP L4 |
|---|---|---|---|---|
| A | 0.366 | 0.349 | 0.309 | 0.248 |
| B | 0.442 | 0.421 | 0.313 | 0.148 |
| C | 0.164 | 0.153 | 0.116 | 0.111 |
| All CONUS | 0.313 | 0.297 | 0.242 | 0.181 |